Blog
FlowHQ
20 May 2026
7 Min Read
Email Marketing Benchmarks 2026: What Good Actually Looks Like
"Are our email numbers good?"
It's one of the most common questions we hear from marketing teams. And the honest answer is: it depends — but here's how to figure it out.
Benchmarks are useful reference points, not absolute standards. What looks like a healthy open rate in one sector is underperforming in another. A DTC brand emailing daily will have very different engagement metrics from a B2B consultancy emailing monthly. Context matters.
That said, here's where the bar actually sits in 2026 — and more importantly, what actually moves the numbers.
A note on open rate measurement
Before diving into benchmarks, it's worth addressing the elephant in the room: Apple Mail Privacy Protection (MPP), introduced in 2021, significantly inflated open rate figures across the industry by pre-loading email content (and thus triggering open tracking pixels) regardless of whether someone actually opened the email.
As a result, raw open rates are less reliable as a measure of genuine engagement than they used to be. Many platforms now distinguish between "machine opens" (triggered by MPP) and "human opens" (actual engagement). Where possible, focus on click-to-open rate and actual click rates as your primary engagement indicators.
With that caveat noted, here are the benchmarks.
Overall email marketing benchmarks 2026
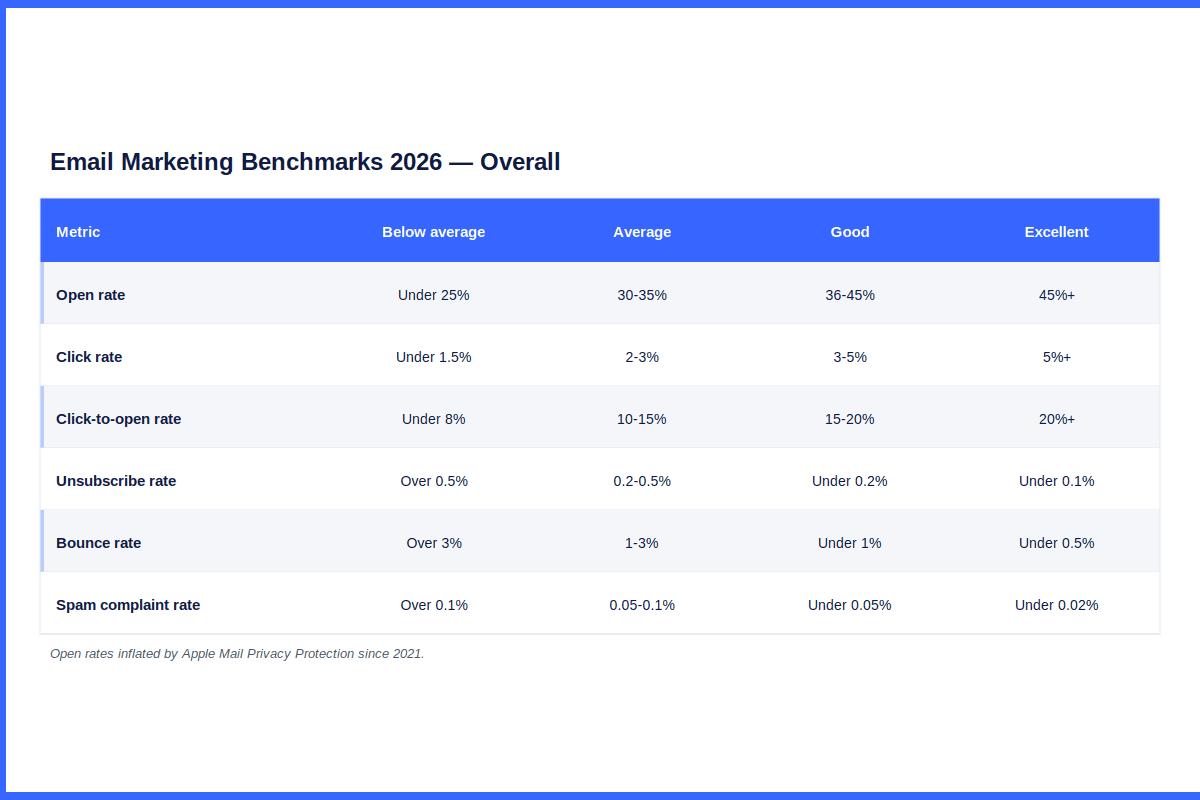
Note: Figures reflect industry averages across multiple data sources and vary by sector, send frequency, and list quality.
Benchmarks by industry
Industry context matters enormously. Here's a rough guide to how open rates vary by sector:
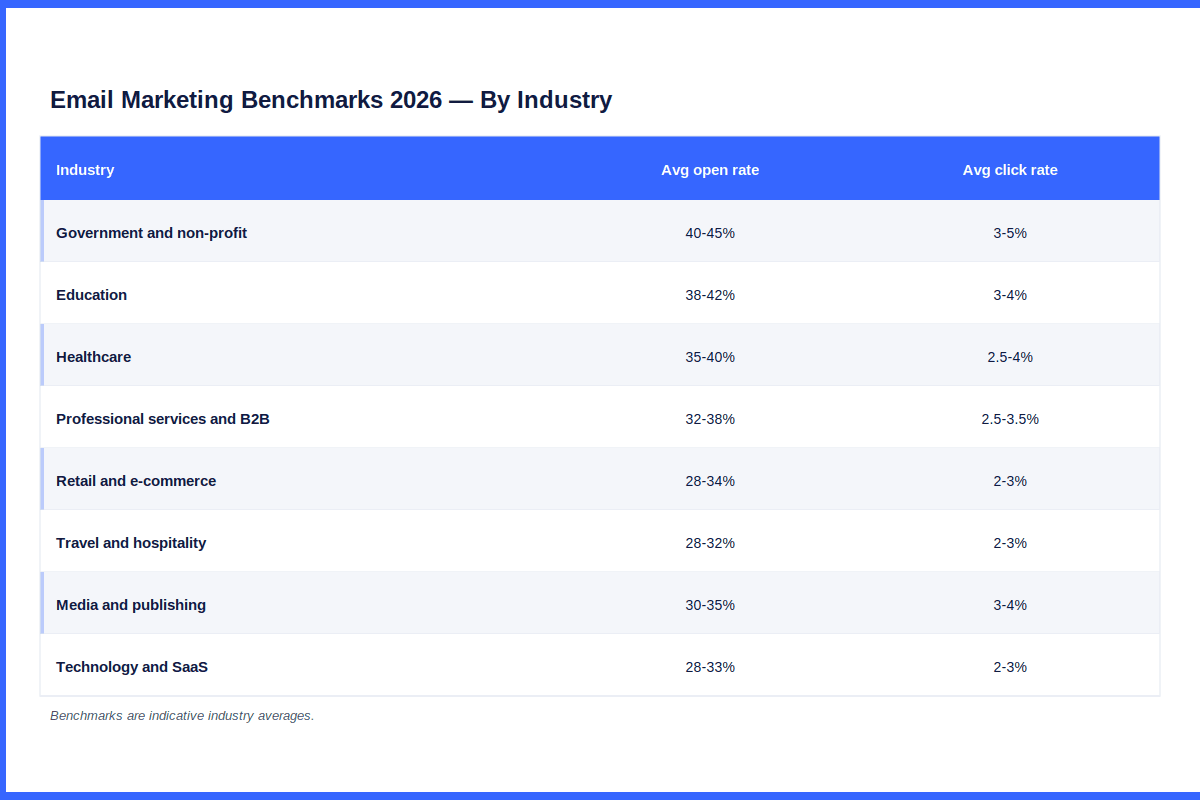
Sectors with higher trust, more targeted audiences, or less email volume (government, education, healthcare) tend to see higher open rates. High-frequency consumer email (retail, travel) tends to see lower rates simply due to volume.
Revenue benchmarks for e-commerce
For e-commerce businesses, engagement metrics matter — but revenue per recipient is the number that actually tells you if your email program is working.
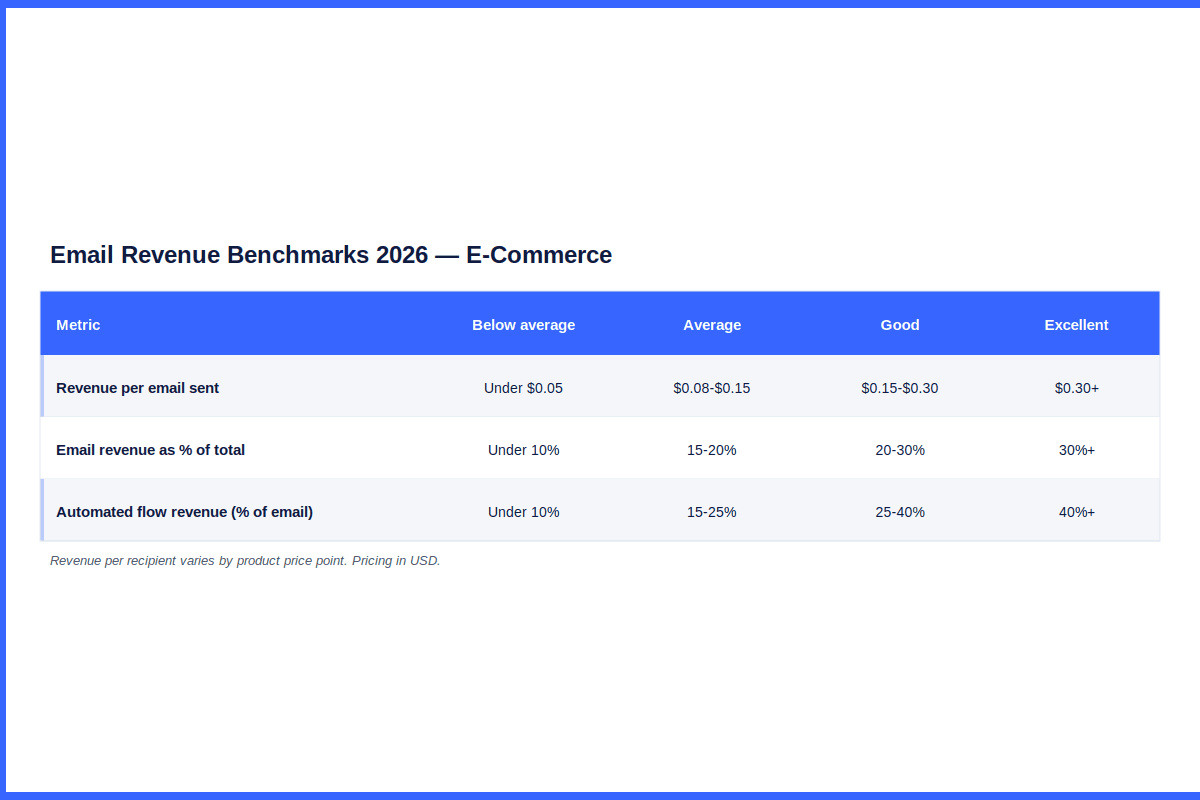
Revenue per recipient figures vary significantly by product price point and purchase frequency. A high-ticket brand will see higher revenue per recipient on fewer sends than a consumables brand.
What actually moves the numbers
Knowing the benchmarks is useful. Knowing what drives performance is more useful. Here's where to focus:
Subject lines and preview text
The subject line is the single most important variable in email marketing. Everything else — design, copy, timing — only matters if someone opens the email first. A/B testing subject lines should be a standard part of your programme, not an occasional exercise.
What works: specificity, curiosity, personalisation, numbers, directness. What doesn't work: clickbait that doesn't deliver on its promise, excessive punctuation, overly promotional language.
Segmentation
The second most impactful variable. An email sent to the right segment will consistently outperform the same email sent to everyone. At minimum, segment by:
- Customers vs non-customers
- Active vs lapsed (engagement-based)
- Purchase category or interest (for e-commerce)
- Lead source or funnel stage (for B2B)
Send frequency and timing
There's no universal answer to how often you should send or what time works best — it depends on your audience, your content, and your category. What matters is testing systematically and measuring the results over a long enough window to see patterns.
Over-sending to an unresponsive list is the fastest route to high unsubscribe rates and poor deliverability. If your engagement metrics are declining over time, reducing frequency is often more effective than improving content.
List hygiene
A clean list outperforms a large one every time. Regularly suppressing unengaged contacts (typically: no open or click in 90–180 days) improves deliverability, reduces costs on contact-volume pricing, and makes your engagement metrics an accurate reflection of your active audience.
Do you have a sunset strategy?
A sunset strategy is the systematic process of handling unengaged subscribers before they become a deliverability problem. Here's how it works:
- Identify contacts who haven't engaged (opened or clicked) within a defined window — typically 90–180 days depending on your send frequency
- Enter them into an automated re-engagement sequence — a short series of emails specifically designed to win back their attention, often with a compelling subject line or offer
- If they still don't engage after the re-engagement sequence, suppress them from future sends
This matters for three reasons: it protects your sender reputation (inbox providers watch engagement rates closely), it improves the performance metrics you actually care about, and it saves you money — most email platforms charge by contact volume, so suppressing dead weight directly reduces your bill.
A well-configured sunset strategy runs automatically in the background. It's one of the highest-ROI automations a business can build, and one of the most overlooked.
Mobile optimisation
The majority of email opens now happen on mobile devices. An email that looks great on desktop but breaks on a phone is losing significant engagement. Test every send on mobile before it goes out.
The most important benchmark is your own history
Industry benchmarks are useful for orientation. Your own historical data is the most useful benchmark for your business.
If your average open rate has been 32% for the last 12 months and it drops to 24% over the next quarter, that's a signal worth investigating regardless of what the industry average says. Conversely, if you're running at 28% in a sector where 32% is typical, you might have a subject line problem worth addressing — but you might also be sending at higher frequency to a less targeted audience, which would explain the gap without indicating a problem.
Track your own metrics consistently, set internal benchmarks based on your history, and use industry averages as context rather than targets.
When to investigate
Some signals that something is worth looking into:
- Declining open rate over 3+ consecutive months — subject line fatigue, deliverability issue, or audience mismatch
- High open rate, low click rate — subject lines are working but content or CTAs aren't
- High click rate, low conversion — email is working but landing page or offer isn't
- Unsubscribe rate above 0.3% — frequency, relevance, or expectation mismatch
- Spam complaint rate above 0.05% — serious deliverability risk requiring immediate attention
- Bounce rate above 2% — list quality issue, typically from purchased lists or lack of list hygiene
FlowHQ helps businesses audit, improve, and optimise their email marketing programmes. If your numbers aren't where you'd like them — or you're not sure what good looks like for your specific situation — let's talk.
More Articles For You To Read
CRM Comparison 2026: What to Look for When You’re Scaling Fast
Growth exposes every weakness in your tools. Here's a practical framework for choosing the right CRM at each stage of your business — and avoiding the migration you'd rather not do twice.
Continue Reading